

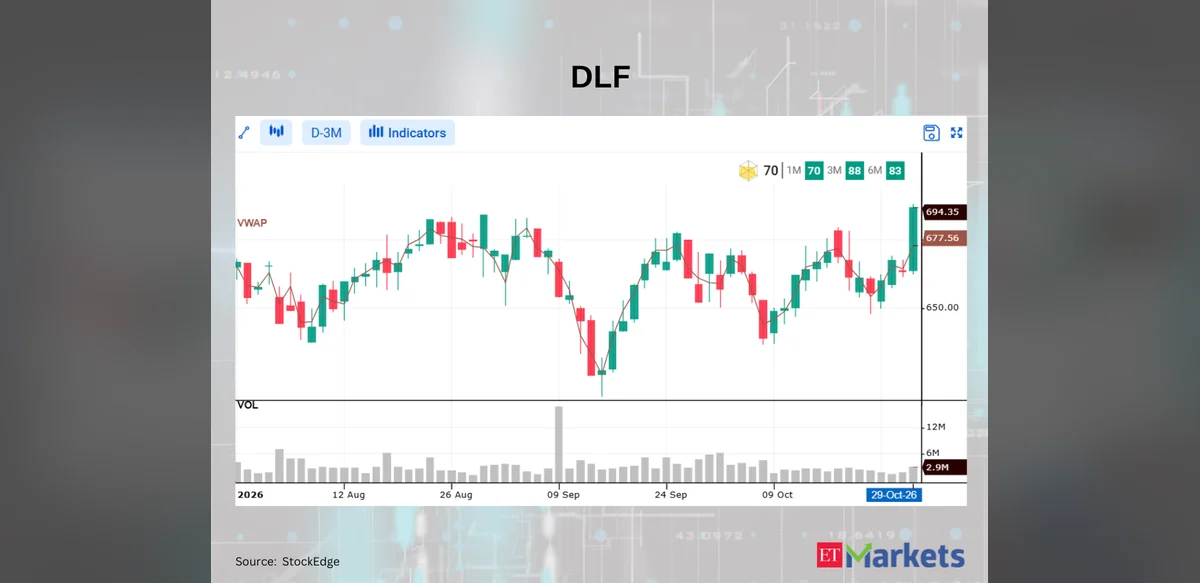
Market observers noted that four constituents of the broad Nifty500 index concluded their trading session more than one and a half percent higher than their respective volume-weighted average prices on the twenty-ninth of October. Data compiled through a technical screening tool highlighted this outcome, which signals that the shares traded at levels exceeding the average price calculated from both volume and price activity throughout the day.
The volume-weighted average price serves as a benchmark that many market participants monitor closely because it incorporates the size of each transaction rather than treating every trade equally. When a stock settles noticeably above this benchmark, it can reflect sustained buying interest that lifted prices beyond the typical execution level seen during the session. In this instance, the four stocks met the threshold of a one-point-five percent premium, drawing attention from analysts who track such technical signals.
Tata Capital was identified among the group that achieved this result. The company, active in financial services, joined three unnamed peers in posting the described performance. The scan did not provide further details on the remaining three constituents, focusing instead on the collective count and the magnitude of the deviation from their individual volume-weighted benchmarks.
Such occurrences are routinely captured by automated screening systems that sift through large volumes of price and volume data at the close of each trading day. These tools help surface patterns that might otherwise require manual review of hundreds of securities. On the date in question, the filter isolated precisely four members of the Nifty500 universe that satisfied the stated criteria.
The Nifty500 itself encompasses a wide cross-section of listed companies across multiple sectors, offering a representative view of the broader Indian equity market. Movements within this index are therefore watched for indications of sentiment that may extend beyond individual stocks. The fact that a small number of constituents closed materially above their volume-weighted averages does not by itself imply a directional trend for the index as a whole, yet it supplies one data point among many that traders consider when assessing intraday momentum.
Market professionals often interpret a close above the volume-weighted average price as evidence that buyers were willing to pay progressively higher amounts as volume accumulated. Conversely, finishes below the benchmark can suggest that sellers dominated at higher levels. In the reported case, the four stocks cleared the one-and-a-half-percent hurdle, placing them in a distinct category relative to the remainder of the index members screened on the same day.
No additional context regarding sector affiliation, market capitalization, or subsequent price action was supplied by the scan. Observers therefore treat the information as a snapshot rather than a forecast. The emphasis remains on the technical condition observed at the close: settlement prices exceeding the volume-adjusted average by the specified margin.
Investors and algorithmic strategies that reference volume-weighted metrics may incorporate such findings into their decision frameworks. For instance, some systems flag securities that demonstrate strength relative to this intraday measure as candidates for further monitoring. The four stocks identified on October twenty-ninth entered that category based solely on the closing differential reported by the screening service.
Overall, the episode illustrates how routine technical scans continue to isolate discrete instances of price behavior within large equity universes. The inclusion of Tata Capital alongside three other Nifty500 names underscores that the phenomenon was not limited to a single issuer, even while the total count remained modest. Market participants seeking to understand daily price discovery can reference these outputs alongside other indicators such as order flow, sector rotation, and macroeconomic releases.
The underlying calculation of the volume-weighted average price itself remains consistent across securities. It multiplies each trade price by its corresponding volume, sums the products, and divides by total volume for the period. A closing price that exceeds this figure by more than one and a half percent simply indicates that the final transaction occurred at a level higher than the volume-adjusted mean. The four stocks satisfied this arithmetic condition on the referenced date.
Continued application of similar filters on subsequent trading sessions will reveal whether the pattern repeats or dissipates. For now, the record stands that exactly four Nifty500 constituents, one of which was Tata Capital, met the stated threshold on October twenty-ninth according to the technical scan employed.