This weekly compilation presents data-based insights through charts to examine key economic developments from the past week. The focus areas include monetary policy signals from the central bank, agricultural challenges linked to weather patterns, and shifts in employment within rural regions.
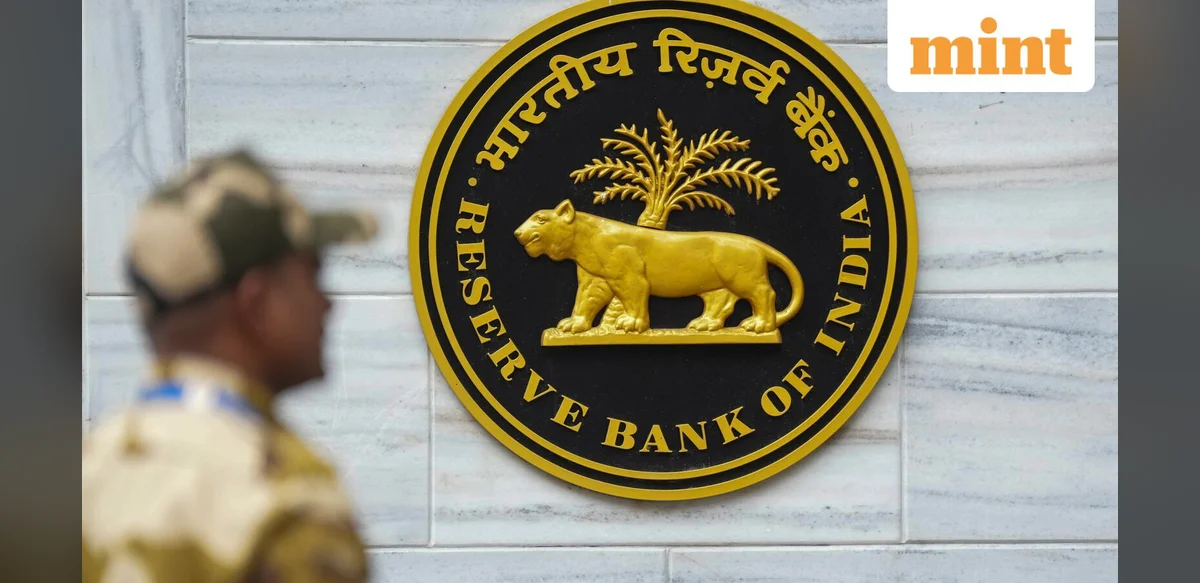
The Reserve Bank of India released minutes from its latest policy meeting. These documents indicated a cautious stance on inflation control. Analysts noted references to persistent price pressures in certain sectors. Charts in this section illustrate trends in benchmark interest rates over recent quarters. One visualization compares inflation readings with policy rate adjustments since the start of the year. Another displays projections for growth alongside liquidity measures.
Data on rural conditions highlighted concerns over water availability. A drought warning was issued for several states based on rainfall deficits. Related charts track monsoon performance against historical averages. Additional graphs show impacts on crop sowing patterns and reservoir levels across major basins. These visuals help contextualize potential effects on food supply chains.
Employment figures from rural areas formed another key segment. Surveys indicated changes in workforce participation rates. Charts depict monthly variations in job types, including agricultural labor and non-farm activities. Comparisons with urban trends provide broader perspective on migration patterns and income sources.
Overall, the charts aim to offer clear representations of complex indicators. Readers can examine correlations between policy decisions, climate factors, and labor dynamics. The presentation maintains a focus on verifiable data points without interpretive commentary.
Further sections explore currency movements and trade balances. Visuals compare export volumes with import values in recent periods. Inflation components are broken down by category, showing contributions from food, fuel, and services. Monetary aggregates appear alongside credit growth metrics.
Agricultural policy discussions reference ongoing support mechanisms. Charts outline subsidy allocations and their distribution across regions. Drought management strategies are illustrated through timelines of government interventions.
Rural workforce data includes breakdowns by gender and age group. Participation rates are plotted against seasonal factors. These elements connect to broader economic indicators such as consumption patterns.
The compilation concludes with summary views that aggregate the main themes. All charts use consistent scales for ease of comparison. Data sources remain limited to official releases and established statistical agencies.
This approach supports informed examination of weekly developments in the Indian economy. The format emphasizes accessibility while preserving the integrity of underlying numbers.